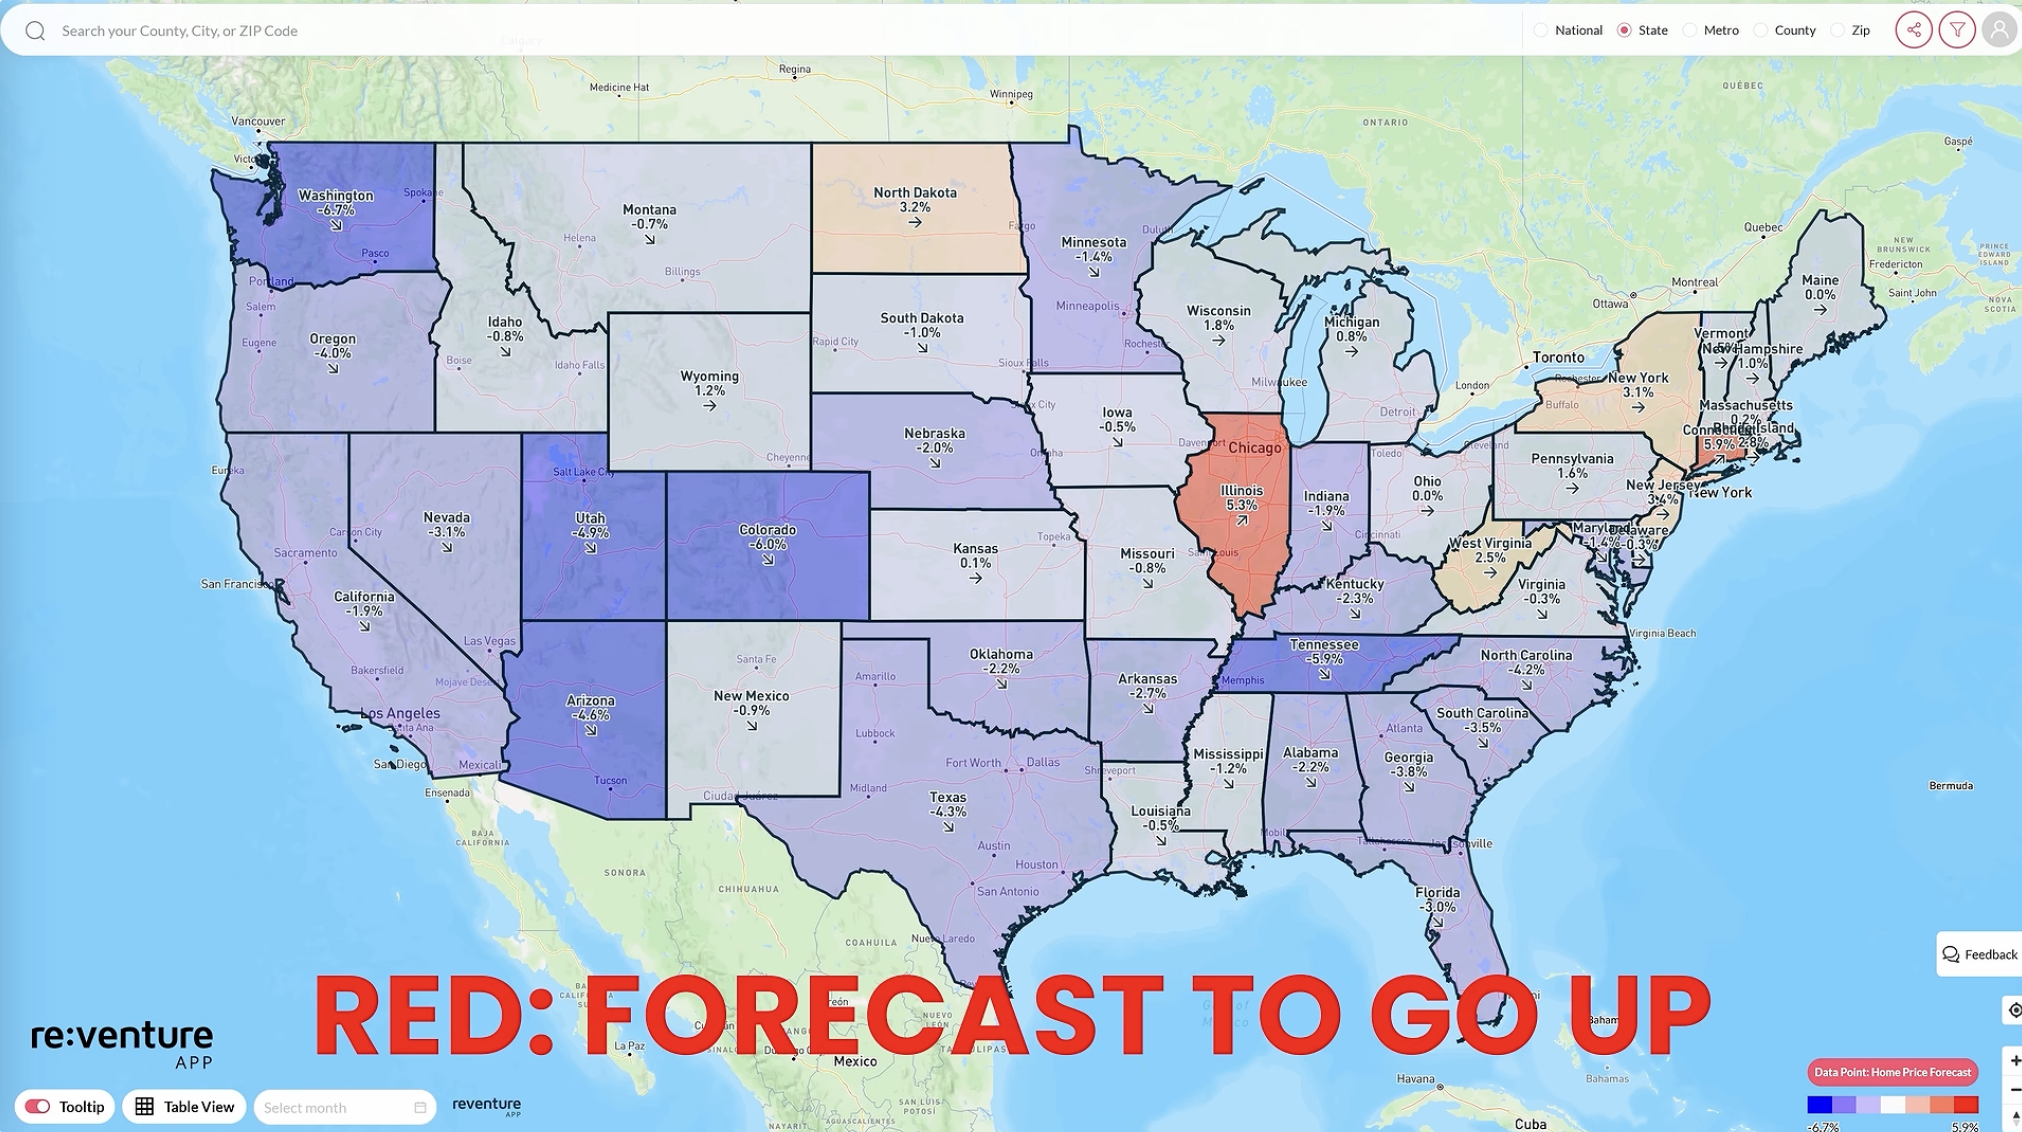
Yes, in most of the country. Pending home sales just hit their lowest level on record, and Reventure forecasts falling prices across much of the South and West in 2027. But wealthy, supply-constrained suburbs near New York City, San Francisco, and Chicago are still rising, some by double digits.
Find your market on the Reventure forecast map to see whether prices are forecast to rise or fall where you live.
Key takeaways
- Contract signings on existing homes fell to a record low in September 2026, and builder confidence hit its lowest level since 2012.
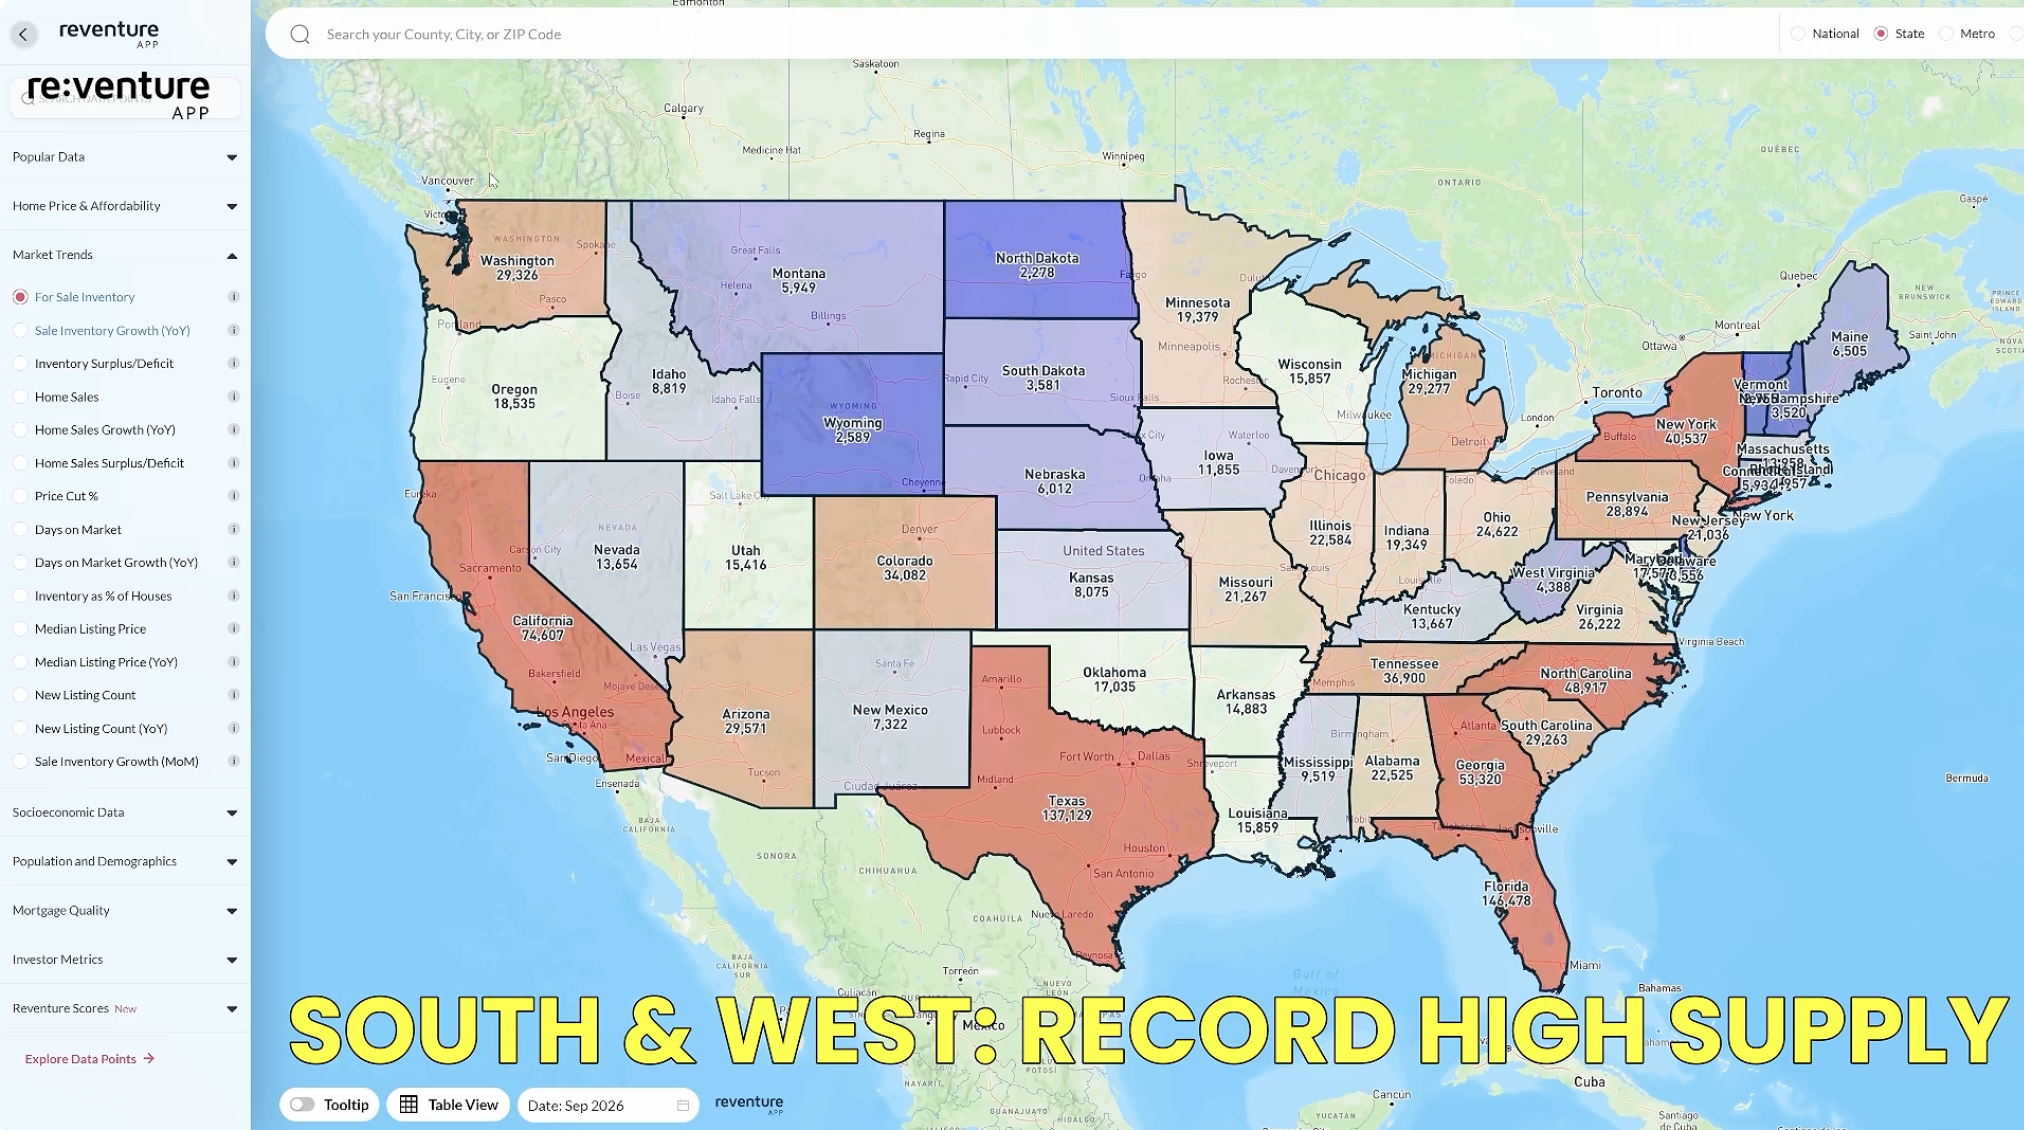
- Tennessee, Colorado, and Washington now have the largest inventory surpluses, with supply as much as 50% above normal.
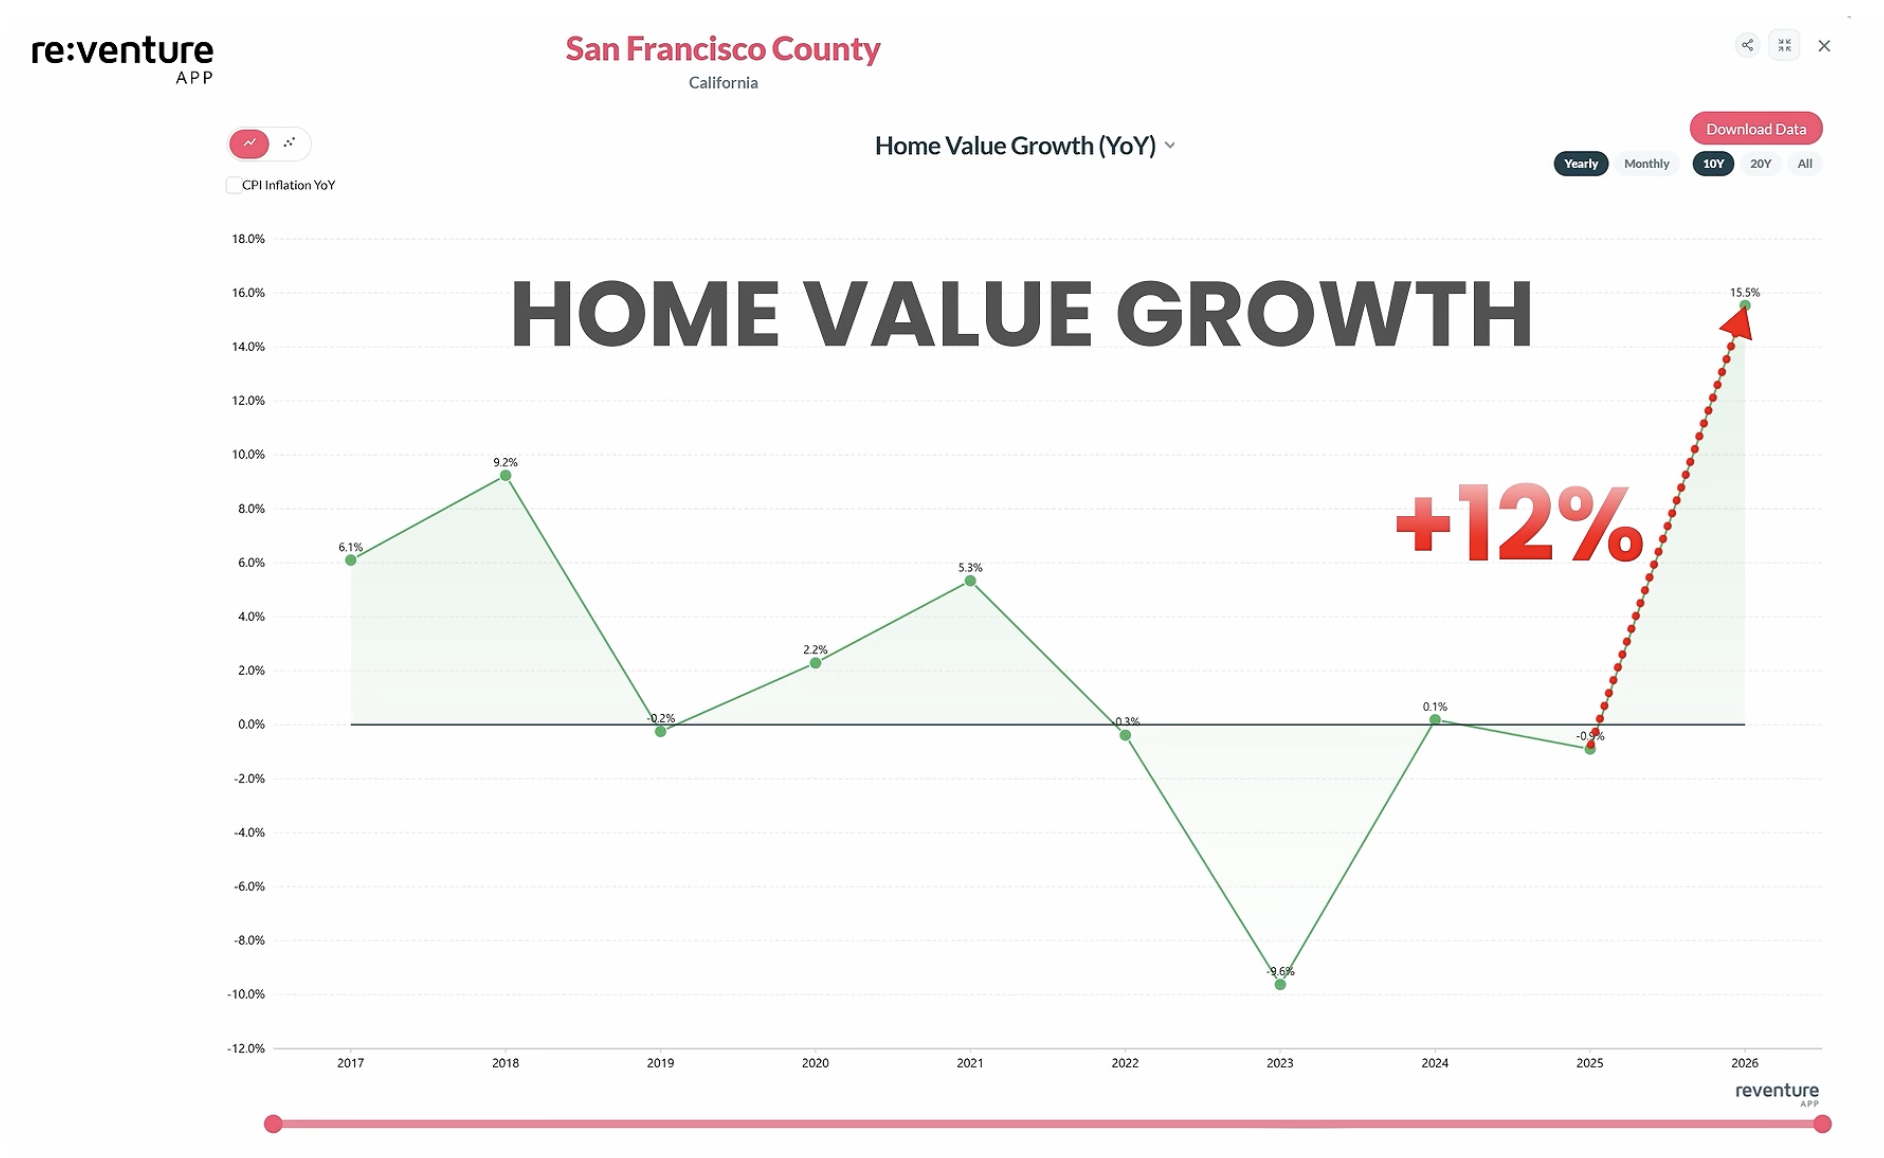
- San Francisco County, Western Connecticut, and Westchester County lead the country in home price growth.
- The split comes down to supply, income, and proximity to major job centers. Rising rents are the clearest sign that a market’s price growth is supported.
Why is the housing market going down?
Buyer demand has collapsed. Two reports released in the same week in October showed the weakest housing activity in well over a decade.
Pending home sales hit a record low
The National Association of Realtors’ Pending Home Sales Index, which tracks signed contracts on existing homes, fell 7.3% in September to 66.0. That is the lowest reading since the index began in 2001, and 11.3% below a year earlier (Bloomberg, HousingWire). Contracts fell in all four regions, with the West dropping the most.
By Reventure’s analysis, contract signings are now about 50% below their pandemic peak and 35% to 40% below pre-pandemic levels. They are also lower than at any point during the 2008–2009 housing bust.
Pending sales matter because contracts typically close within one to two months. September’s record low points to weaker closed sales through the end of the year.
Builder confidence fell to a 14-year low
The NAHB/Wells Fargo Housing Market Index fell to 29 out of 100 in October, its lowest reading since June 2012 (NAHB). The measure of prospective buyer traffic dropped to 18 (Morningstar/Dow Jones).
That puts builder sentiment at levels last seen in the aftermath of the 2008 crash. Builders are responding by cutting prices, offering incentives, and pulling back on new construction.
Why demand is falling
Mortgage rates have climbed back above 7%, with the 30-year fixed rate averaging 7.40% in mid-October, the highest in nearly three years (Reuters via SRN News). Combined with prices that remain near record highs in many markets, that has pushed monthly payments out of reach for most buyers.
Which markets will see prices fall in 2027?
Prices are most likely to fall where inventory has piled up and sales have dried up. That describes much of the South and West, where Reventure forecasts declines over the next 12 months.
Nationally, there were about 1.2 million active listings in September 2026, according to Realtor.com. That is more than double the pandemic low and within about 5% of September 2019 levels. But the supply is unevenly spread. The South and the West Coast are at their highest inventory levels in at least 10 years, while the Northeast and Midwest are still short of homes.
The states with the biggest inventory surplus
| Tier | States | What Reventure’s data shows |
|---|---|---|
| Largest surplus | Tennessee, Colorado, Washington | Supply as much as 50% above normal; Tennessee leads |
| Large surplus | Utah, Arizona, Georgia | Supply roughly 30% to 50% above normal |
| Still elevated | Texas, Florida | High supply, but no longer the top surplus states |
The same states also show a large deficit in closed sales, based on Redfin’s September 2026 data. That combination, plenty of homes for sale and few buyers, is what pushes prices down.

What the falling markets have in common
The markets losing the most value tend to share three traits:
- Heavy new construction. Builders added large amounts of supply during the pandemic boom, and those homes are now competing with resale listings.
- Lower incomes relative to prices. Prices ran far ahead of local incomes, so buyers can’t keep up at today’s rates.
- Smaller down payments. Buyers in these markets depend more on mortgages, so higher rates hit demand harder.
That pattern covers much of Texas, Tennessee, Georgia, Arizona, and Colorado.
Where are home prices still rising?
Only three housing markets in the U.S. are clearly hot right now: New York, San Francisco, and Chicago. Nearly every county at the top of the home value growth rankings is in or around one of these three metros.
The counties with the fastest home price growth
| Rank | Market | Home value growth, past 12 months | Metro |
|---|---|---|---|
| 1 | San Francisco County, CA | +14.5% | San Francisco |
| 2 | Western Connecticut Planning Region, CT (formerly Fairfield County) | +9.5% | New York suburbs |
| 3 | Westchester County, NY | about +7.5% | New York suburbs |
Source: Zillow home value data via Reventure App.
Nassau County on Long Island, Cook County, and the Chicago suburbs also rank near the top. Western Connecticut includes towns like Greenwich, Stamford, and Fairfield, about 40 miles northeast of New York City.

On the ground: Eastchester, New York
Eastchester sits about 20 miles north of New York City in Westchester County. Home values in its ZIP code are up roughly 9% to 12% over the past year, according to Reventure’s data, and values are up double digits across much of the county.

One four-bedroom, three-bathroom home of about 2,400 square feet is listed for about $1.5 million. Buying it with a mortgage would cost more than $10,000 a month. The same house is renting for $10,000 a month, up from about $9,500 three or four years ago. Other single-family rentals nearby are listed at $6,000 to $9,000 a month.
Several things keep prices rising here while most of the country cools:
- Almost no new supply. Westchester was built out 50 to 70 years ago, so there’s little room for new homes, and inventory is still falling.
- Highly rated schools and large lots. Many homes sit on a third of an acre or more, in school districts rated 9 or 10 out of 10.
- Proximity to New York City. The city remains home to more Fortune 500 companies than any other U.S. city, and families leaving it for the suburbs often land here.
- Wealthier buyers with large down payments. Buyers here depend less on mortgages, so high rates hurt demand less.
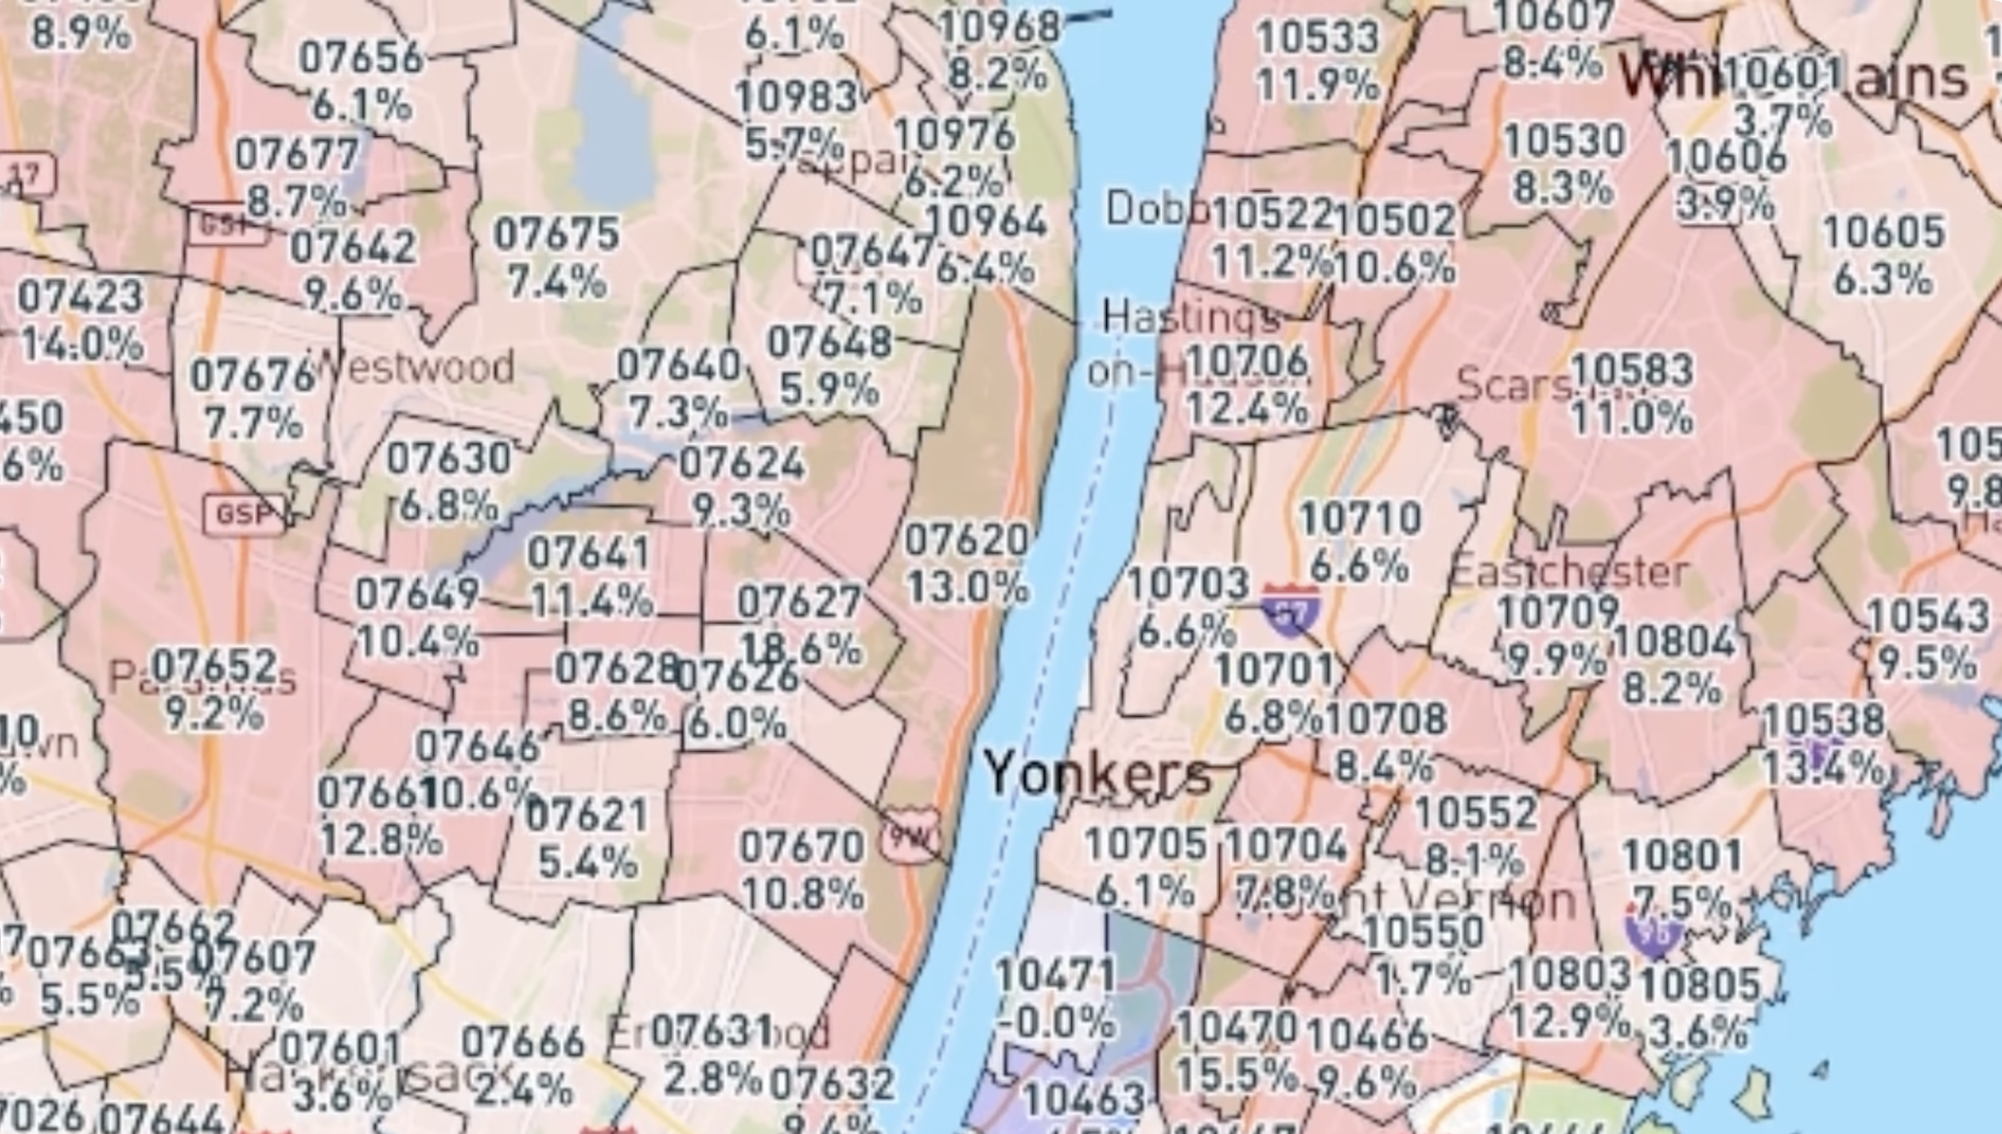
San Francisco’s price growth has a different trigger, the AI boom, but the same underlying signal: apartment rents there are also rising by double digits.
What is a K-shaped housing market?
A K-shaped housing market is one where prices in some areas keep rising while prices in most others fall, like the two arms of the letter K. That is the U.S. market heading into 2027.
The upper arm is wealthy, built-out suburbs near major job centers: limited supply, high incomes, large down payments, and rising rents. The lower arm is newer, more affordable markets in the South and West: heavy construction, rising inventory, and buyers who depend on mortgages.
National headlines average the two arms together, which hides what is happening in both. A national price figure that looks roughly flat can mean double-digit gains in Westchester and steady declines in Tennessee. For buyers, sellers, and investors, the local arm is the one that matters.
How to tell if prices in your market are justified
Compare home prices to rents. If rents are rising alongside prices, price growth is backed by real demand. If owning costs far more than renting, prices are more likely to fall.
Rents reflect supply and demand in real time, because nobody rents a home as a speculative bet. When rents keep climbing, people genuinely want to live in the area, and first-time buyers have less reason to keep renting.
Two markets, two outcomes
| Westchester County, NY | East Nashville, TN | |
|---|---|---|
| Monthly cost to own | About $10,000 (a $1.5M home) | About $2,700 (a $368K home) |
| Monthly rent for a similar home | About $10,000 | About $1,850 |
| Owning vs. renting | Roughly the same | About 50% more to own |
| Price trend | Rising roughly 9% to 12% | Falling; forecast to drop up to 10% |
In Westchester, the rent supports the price: owning costs about the same as renting. In East Nashville, owning costs about 50% more than renting the same home, which gives buyers every reason to wait.
(Read more about East Nashville in our article Will Housing Prices Drop in 2027?)
A rent check doesn’t rule out a bubble. But it is one of the most reliable signals of whether a market’s prices are supported.
Check your market in three steps
- Look up your area’s forecast on the Reventure forecast map to see whether prices are expected to rise or fall.
- Compare the home value to rent ratio with its history. Reventure App now shows an overvaluation rate based on rents, alongside its income-based measure. A ratio well above its long-term norm suggests prices are stretched.
- Check the local supply. An inventory surplus combined with a sales deficit means more competition among sellers and more room for buyers to negotiate.
By both measures, Westchester County is actually undervalued compared to its long-term norms, which helps explain why prices there are still climbing.
Is the housing market going to crash?
A nationwide crash isn’t the most likely outcome, but the downturn in the lower arm of the market could deepen in 2027. Most homeowners have large amounts of equity and aren’t being forced to sell, which tends to produce a slow decline rather than a sudden collapse. The risk is that weak demand drags on long enough to push prices down sharply in oversupplied markets.
The Fed is raising rates into a weak housing market
The Federal Reserve raised its benchmark rate in September 2026, its first hike since 2023, to a range of 3.75% to 4.00%. It held rates steady in October, but two policymakers dissented in favor of another increase, and markets expect another hike in December (Fox Business, Advisor Perspectives).
The Fed is focused on inflation, which has accelerated in recent months. But from Reventure’s point of view, raising rates into the weakest housing demand on record is a risk. Collapsing buyer demand is a deflationary force, and higher rates add pressure on a market that is already struggling.
There is historical context for that concern. In 2006–2007 and in 1929, the Fed kept raising rates while housing was already declining and stock markets were still rising. Both periods were followed by the worst recessions of the past century.
That doesn’t mean a repeat of 2008 or the Great Depression is coming. Today’s banking system, lending standards, and homeowner equity look very different. But when housing data resembles those periods and policy keeps tightening, the risk of a deeper downturn rises.
What could keep prices from falling
- Inflation cools and the Fed reverses course. Lower rates would bring some buyers back.
- The economy stays strong. Rising incomes would close part of the affordability gap.
- Sellers pull listings. If owners delist instead of cutting prices, supply would shrink, though sales would stay low.
Is now a good time to buy a house?
In oversupplied markets, buyers now have more negotiating power than at any point in years, so it’s a good time to start making offers. In supply-constrained markets like Westchester, competition is still strong and discounts are rare.
Where buyers have the most leverage heading into 2027:
- States with inventory surpluses and sales deficits: Tennessee, Colorado, Washington, Utah, Arizona, and Georgia, plus much of Texas and Florida.
- Neighborhoods with heavy new construction, where builders are cutting prices and offering incentives to move inventory.
- Listings that have sat for months. In these markets, the list price is a starting point for negotiation, not a final number.
Fall and winter are often the best seasons to make offers, with fewer buyers competing. Build your market’s forecast into your offer: buying at today’s price in a market forecast to fall means giving up that equity within a year.
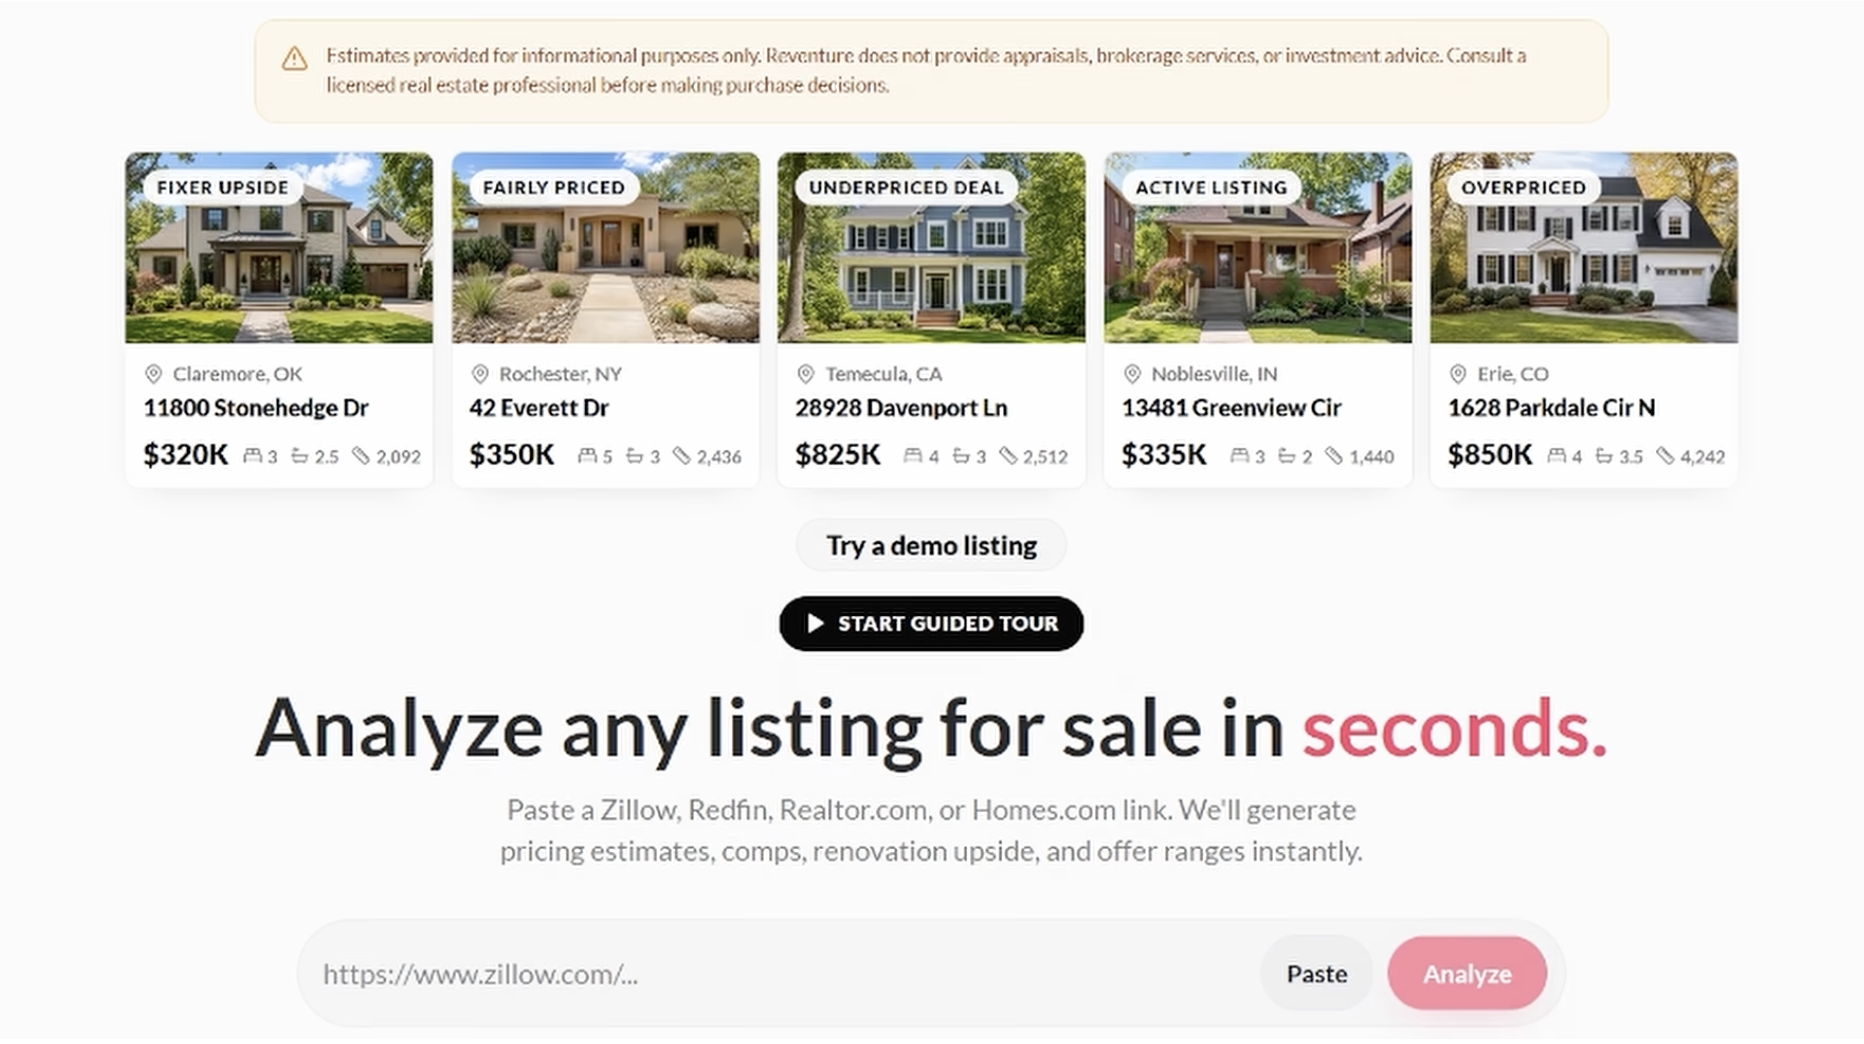
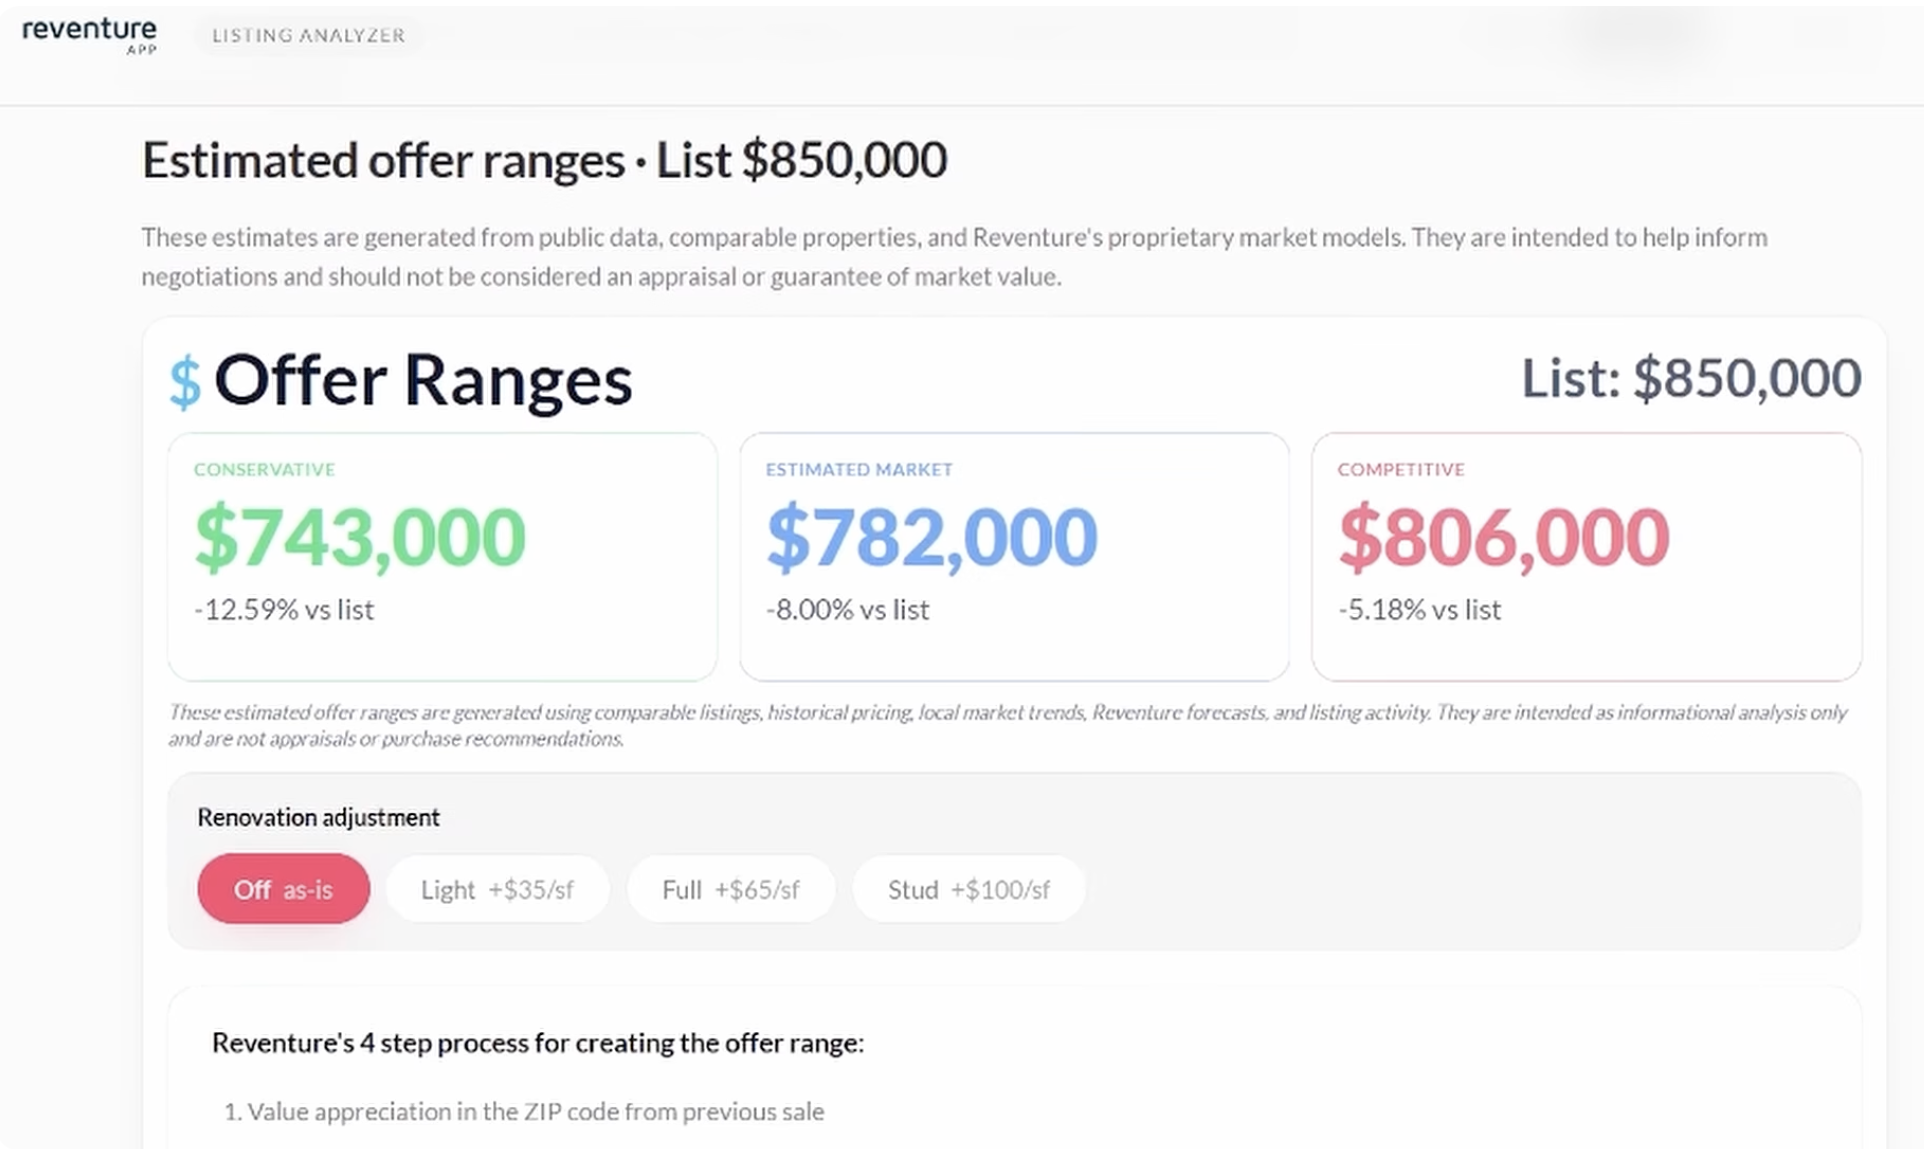
To get an offer range for a specific home, paste a Zillow or Redfin link into Reventure’s listing analyzer. It combines comparable sales, the home’s price history, and the local forecast, and a new rental analyzer estimates cash flow if you plan to rent the property out.
Frequently asked questions
Is the housing market going down in 2027?
In most of the South and West, yes. Reventure forecasts falling prices where inventory has surged, while wealthy suburbs near New York, San Francisco, and Chicago are still rising.
What are the housing market predictions for 2027?
Expect a split market. Prices are likely to keep falling in oversupplied states like Tennessee, Colorado, and Washington, while supply-constrained metros keep appreciating. Pending home sales at a record low point to weak demand into early 2027.
Is the housing market going to crash?
A nationwide crash is less likely than a slow, uneven decline, because most homeowners have large equity cushions. The risk of a deeper downturn rises if weak demand persists and the Fed keeps raising rates.
Where are home prices still rising?
San Francisco County (+14.5%), Western Connecticut (+9.5%), and Westchester County (about +7.5%) lead the country, along with Nassau County, Cook County, and the Chicago suburbs.
Is now a good time to buy a house?
In markets with large inventory surpluses, buyers have strong negotiating power, so it’s a good time to make offers below asking. In tight markets near major job centers, competition remains strong.
How can I tell if my local market is overvalued?
Compare home prices to rents and incomes against their long-term norms. If owning costs far more than renting a similar home, prices are more likely to fall. You can check your area on the Reventure forecast map.
Sources
- Bloomberg: US pending home sales fall to record low
- HousingWire: NAR pending home sales index falls to record low in September
- NAHB: Builder sentiment falls on rising rates (October 2026)
- Morningstar/Dow Jones: Home-builder sentiment sinks to 14-year low
- Reuters via SRN News: mortgage rates and pending sales
- Fox Business: Fed holds rates in October 2026
- Advisor Perspectives: Fed rate decision, October 28, 2026
- Reventure App: forecasts, inventory surplus and sales deficit data, home value growth (Zillow data), and rent-based overvaluation