In November 2024, the New York metro area’s property listings experiencing price cuts dropped to 9.9%, marking a significant shift in the housing market. This price cut percentage reflects a decrease compared to the 13.7% and 11.4% observed in 2022 and 2023 respectively. And is substantially lower than the peak of 17.8% in 2018. Moreover, the data on the Reventure app suggests a stabilization in pricing strategies among sellers with 5,132 listings seeing price cuts out of a total inventory of 51,654. It indicates a stronger demand or reduced urgency to sell in a competitive market.
The following graph by the Reventure app highlights the price cut trend in New York over the years:

By November 2024, there were 5,132 listings with price cut in New York. You can access the graph on the Reventure App. [Link]
Factors Contributing to the Decline in Price Cuts
The decline in price cuts within NY’s housing market is mainly due to a significant decrease in available inventory. New York County experienced an inventory deficit of -4.2% with 6,676 active listings compared to a long-term average of 6,971 in late 2024. The number of homes for sale has also steadily decreased over the last three years. This scarcity limits buyers’ and investors’ options, allowing sellers to maintain higher asking prices without resorting to reductions.
Moreover, the rapid rise in mortgage rates has led to a housing lock effect. As purchasing a new property would subject them to higher rates, homeowners with previously secured low-interest mortgages are hesitant to sell. This reluctance further constrains the housing supply, contributing to declined price cuts in the market.
Regional Price Cut Variations
Kings County (Brooklyn), NY, stands out in the New York Metro area for having the lowest percentage of price cuts on its real estate listings. As the map by Reventure App shows, the county’s price cut % reached 8.0% in November 2024. This contrasts with neighboring counties such as Queens, Nassau, and Suffolk. Moreover, only 356 out of 4,437 properties experienced price reductions across Kings County, emphasizing its stability compared to other regions.
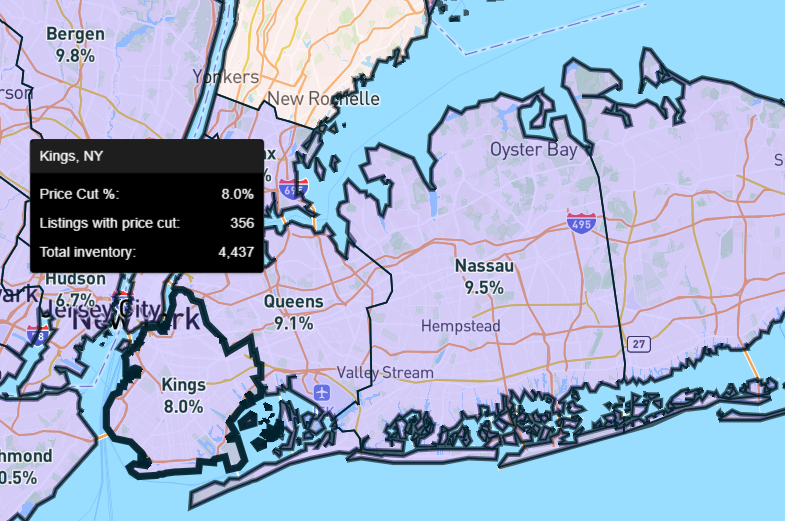
Price Cuts across New York Metro are the lowest in Kings County. Access the price cut map here. Link.
According to the Reventure App’s data, Kings County’s price cut percentage has followed a relatively stable trend, dipping from 8.5% in 2017 to 8.0% in 2024. There were minor fluctuations in between. This consistency, alongside limited price reductions, reflects its resilience and high demand. It also underscores its appeal to buyers and investors. Moreover, the limited price cuts signal a strong housing market where properties retain value better than in neighboring counties.
Implications for Buyers and Sellers in 2025
In 2025, the New York Metro housing market will likely favor sellers due to constrained inventory and resilient demand. Based on the Reventure App data, The Home Price Forecast of 59 indicates moderate upward price pressure, supported by a Value-to-Income ratio of 6.9 and steady home value growth of 7.2%. The low price cut percentage of 9.9% from 2024 highlights a competitive market where sellers are less inclined to reduce prices, reflecting strong demand and limited housing supply.

Home Price Forecast for New York Metro shows that sellers will have an edge over buyers/ investors. Access the home price forecast map here. Link.
The decline in price reductions could signal a tightening housing market or a shift in buyer-seller dynamics. Historically, high price cut percentages often imply sellers are adjusting expectations to attract buyers amid weaker demand. However, the current low figure may suggest resilience in home prices, buoyed by steady demand or constrained inventory. For potential buyers, this indicates fewer opportunities for discounts, while sellers may find themselves in a favorable position to negotiate deals closer to asking prices.
Moreover, price cut percentages are projected to remain low. This trend aligns with the Value-to-Income ratio of 6.9, highlighting the affordability challenges compared to nearby regions. Sellers in New York should maintain pricing power, supported by a competitive market environment where home value growth is steady at 7.2%. Buyers in 2025 may encounter fewer discounts but benefit from stabilizing mortgage terms.
This trend could shape buyer strategies heading into 2025, especially if broader economic conditions continue to impact affordability and real estate activity in New York. Access the housing market data at a ZIP-code level in New York to see the trends for your neighborhood on the Reventure App.