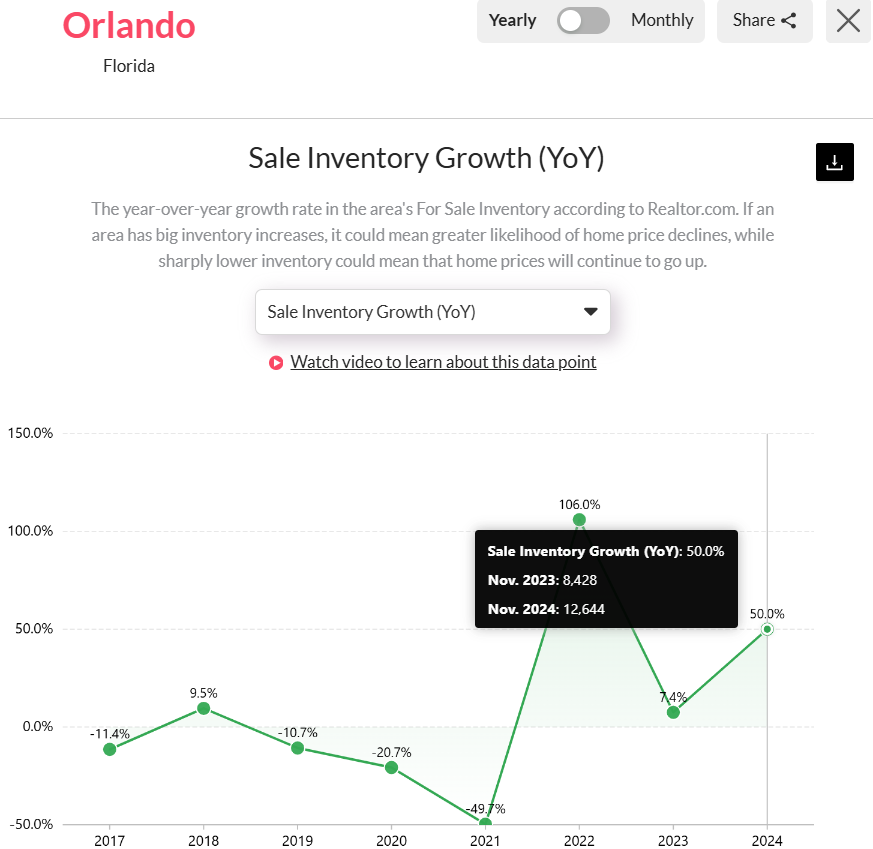
Orlando, FL, experienced a significant surge in inventory growth in late 2024, with a remarkable 50% year-over-year increase in inventory levels as the active listing hit 12,644. This remarkable increase underscores a recovery from years of inventory decline, particularly between 2017 and 2021. The surge highlights a shift in market dynamics, creating a less pressured environment for buyers after an extended period of limited supply.
By November 2024, active listings in Orlando had risen to 12,644, a considerable jump from the 8,428 listings recorded in November 2023. Notably, this figure surpassed the previous long-term average of 8,646, reflecting a clear departure from the historically constrained market of recent years. This growth represents the highest inventory levels Orlando has experienced in the last seven years, signaling increased housing availability and opportunities for buyers and investors. Below is Reventure App’s graph that explains the sales inventory growth over the years:
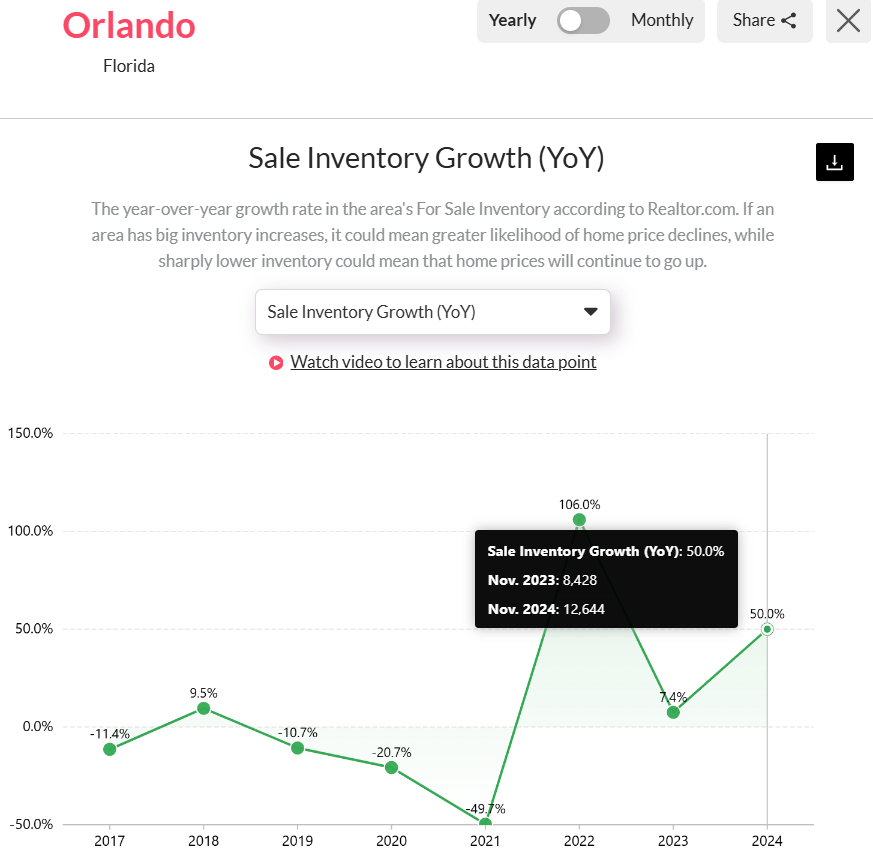
Orlando’s YoY has been fluctuating over the years. You can access the sales inventory chart here. [Link]
Before this growth, Orlando’s inventory levels had shown significant fluctuations. Between 2017 and 2020, the market faced consecutive declines, culminating in a steep drop of -20.7% in November 2020. The decline reached its lowest point in 2021, with inventory growth hitting a record-low rate of -49.7%.
However, the market rebounded sharply in 2022, experiencing a remarkable 106% growth in inventory, a complete reversal of the prior trend. While growth moderated to 7.4% in 2023, the subsequent 50% increase in 2024 highlights a sustained recovery in housing supply.

Orange County has seen the highest inventory growth in Orlando, FL. You can access the numbers here. [Link]
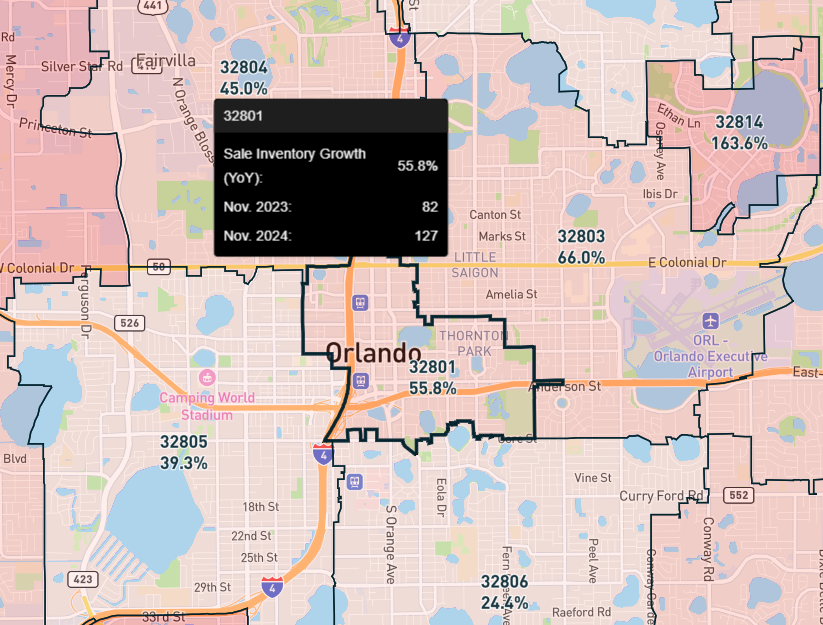
The growth in inventory has not been uniform across Orlando but has varied by region and county. Among the counties in the Metro Orlando area, Orange County posted the highest year-over-year inventory growth by the end of 2024. As active listings in Orange County rose by 59.9%, reaching 4,954 listings, significantly higher than its long-term average of 3,630. This marks the largest inventory expansion the county has seen in the past six years.
Other counties, including Osceola and Seminole, also experienced noteworthy increases in active listings. The rise in housing supply across these areas signals evolving market conditions, with slower demand and growing availability reshaping Central Florida’s real estate market. These changes are creating opportunities for buyers who had previously faced constrained options in the region. You can access the county level analysis on the Revanture app.
Key Factors Impacting Orlando’s Sales Inventory Growth in Late 2024
According to the data available on Reventure App, the sharp increase in Orlando’s housing inventory during late 2024 can be attributed to several factors. A primary driver has been the rise in mortgage rates, which reached approximately 6.8% in November 2024. Higher borrowing costs have also deterred a significant number of buyers, leading to reduced demand. Consequently, homes have remained on the market for longer periods, causing listings to accumulate.
Moreover, the Orlando housing market experienced a broader decline during this period, with inventory continuously rising over several months. This shift in dynamics has increased the range of options available to buyers, leading them to take a more deliberate approach to purchasing rather than rushing to make quick decisions. These two factors, elevated mortgage rates and a cooling market, overall played pivotal roles in driving the observed inventory growth. Access the demographic level data on Reventure app.
Orlando, FL Inventory Predictions for 2025
Looking ahead, forecasts for Orlando’s housing market suggest a continuation of current trends into 2025. Based on data from Reventure App, Orlando’s home price forecast score stands at 38, indicating a declining market. This score reflects weakening buyer demand and increased seller activity, suggesting continued downward pressure on home prices.
Further indicators reinforce these predictions. An increasing share of listings with price cuts and longer Days on the Market reflect slowing sales as sellers adjust their strategies to attract buyers. Additionally, Orlando’s inventory score of 24 points to a supply surplus relative to demand supports expectations of a buyer-friendly market in the forthcoming year.
Orlando, FL’s home price forecast depicts a continued declining market in 2025. Access the home price forecast scores for Orlando, FL over the years here. [Link]
The shifting economic conditions, including sustained high mortgage rates and increased housing options, have steered Orlando away from its historic status as a strong seller’s market. Now, the area is firmly positioned as a buyer’s market. This means that buyers are more likely to benefit from falling prices and increased options in the housing market over the next year. To see specific trends for your neighborhood, access housing market data at a ZIP-code level in Orlando on the Reventure App.