Housing markets don’t stand still. Prices shift. Forecasts change. And September 2025 brings a new chapter. Reventure’s latest update shows where the U.S. housing market is headed. The numbers tell a story of winners and losers. Some states are still climbing. Others are falling hard.
We’ll walk you through the highs and lows. You’ll see how much value has grown since last year. And where they might be one year from now. Why does it look this way? Inventory, price cuts, days on market. Each factor shapes the map. Let’s break it down.
Strongest Housing Markets in September 2025
1. Connecticut – Leading the Pack
Connecticut tops the forecast charts. It has a 6.9% expected home price increase over the next year. Moreover, it has a modest 3.8% year-over-year growth. And the inventory is tight with just over 5,000 homes for sale. Days on market average 43, suggesting steady buyer activity. Limited supply combined with resilient demand is pushing prices higher.
2. Illinois – A Surprise Climber
Illinois comes in second with a 5.7% price forecast. Home values grew 3.5% year-over-year, and the state has a larger pool of listings at more than 21,000. Even with a high 21.3% of listings seeing price cuts, demand is keeping pace. Homes move quickly in just 38 days, showing that buyers are willing to step in at the right price.

Connecticut leads as the strongest housing market forecast for 2025. Access the above graph here. [Link]
3. New Jersey – Demand Outpaces Cuts
New Jersey posts a 5.6% price forecast and the strongest annual growth in this group at 4.1%. Inventory sits at 17,626 homes, and price cuts mirror Connecticut at 14.7%. Buyers are still competitive, reflected in a 40-day average time on market. Dense population and commuter demand into New York City continue to buoy the state’s outlook.
4. Rhode Island – Small but Strong
With a 4.3% forecast, Rhode Island holds its ground as a niche market. Its inventory of just 1,618 homes is extremely tight, and homes sell in 39 days. Year-over-year growth of 3.8% shows stable appreciation, supported by limited supply and coastal desirability.
5. Wisconsin – Midwest Momentum
Wisconsin rounds out the top five at 4.2% forecast growth. Annual values are up 3.8%, and inventory sits at 12,714. Even with 21.2% of listings facing price cuts, homes sell in 42 days. Buyers are still active, keeping momentum strong in the Midwest market.
Weakest Housing Markets in September 2025
1. Puerto Rico – Steepest Decline Ahead
Puerto Rico faces the sharpest correction with a -17.6% forecast. Market indicators remain thin, but the scale of decline reflects serious weakness in demand. Affordability pressures and limited economic drivers make recovery challenging in the near term.
2. District of Columbia – Overvaluation Weighs Heavy
D.C. shows a -6.9% forecast, with home values already falling -3.8% year-over-year. The market is flagged as 20.9% overvalued, with a value-to-income ratio of 5.2. Even though just 17.9% of listings show price cuts, high valuations and affordability strain continue to push prices lower.
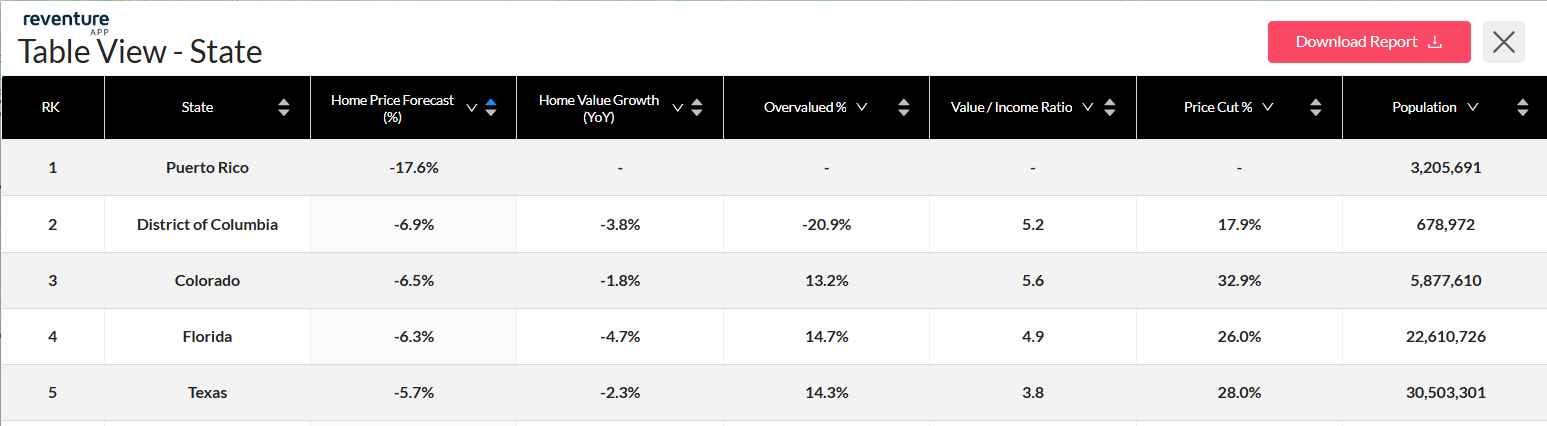
Puerto Rico leads the steepest declines, with D.C., Colorado, Florida, and Texas also facing sharp downturns. Access the above graph here. [Link]
3. Colorado – High Cuts, Weak Growth
Colorado’s housing market carries a -6.5% forecast and a recent -1.8% decline in home values. Overvaluation sits at 13.2%, and buyers are gaining leverage with nearly 33% of listings seeing price cuts. Despite population growth, oversupply and affordability concerns make for a tough year ahead.
4. Florida – From Hotspot to Cooldown
Florida projects a -6.3% forecast, the result of rapid pandemic-era gains now reversing. Year-over-year values fell -4.7%, and 26% of listings have price cuts. With over 22 million residents, the sheer size of the market magnifies its impact on national trends. Overvaluation at 14.7% shows how far prices ran ahead of fundamentals.
5. Texas – A Cooling Giant
Texas rounds out the bottom five with a -5.7% forecast and a -2.3% drop in annual values. Overvaluation sits at 14.3%, while nearly 28% of listings are cutting prices. With the nation’s second-largest population, the state’s slowdown is significant. After years of breakneck growth, affordability and oversupply are pulling the market back.
Get Local Market Clarity with Reventure App
To help make sense of the shifting trends for your own market, go to Reventure App. It offers real-time data for several housing market metrics, all the way down to the ZIP code, for just $49/ month.
Localized insight from Reventure App empowers buyers to spot neighborhoods with the lowest prices. It also helps sellers align with current market realities, making it easier to make smarter, better-timed decisions in a cooling, yet still competitive, housing market.