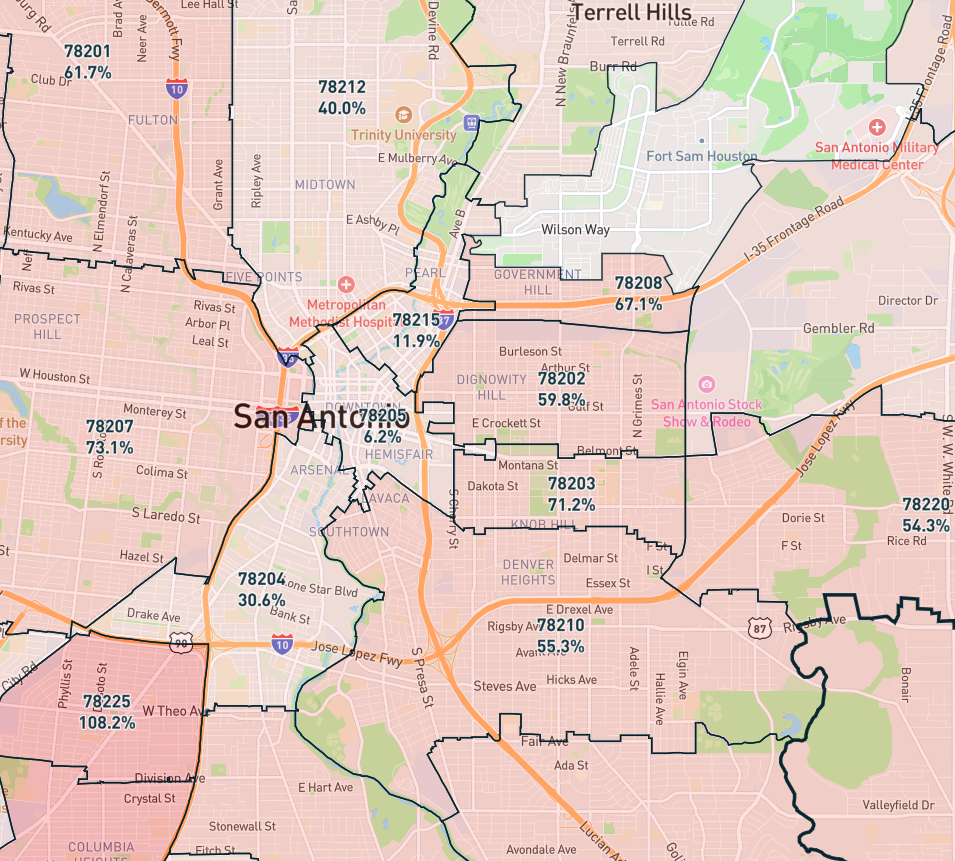
San Antonio, TX, is witnessing a notable shift in its real estate market as inventory surplus surged to 40.4% in late 2024. With 11,015 active listings compared to a long-term average of 7,841, the city now has significantly more homes available than usual. This sharp increase in inventory signals potential downward pressure on home prices, aligning with forecasts suggesting a cooling market. This presents an opportunity for buyers to negotiate better deals.
San Antonio,TX Inventory Surplus/ Deficit YoY Analysis
Over the years, San Antonio, TX, has experienced fluctuating inventory surplus and deficit levels, reflecting the changing dynamics of its housing market. In 2017, the inventory surplus stood at 7.2%, gradually increasing to 16.5% by 2019. However, the market shifted sharply in 2020, with a deficit of -35.5%, followed by a steep -49.9% in 2021. It was driven by reduced housing supply and high buyer demand during the pandemic.
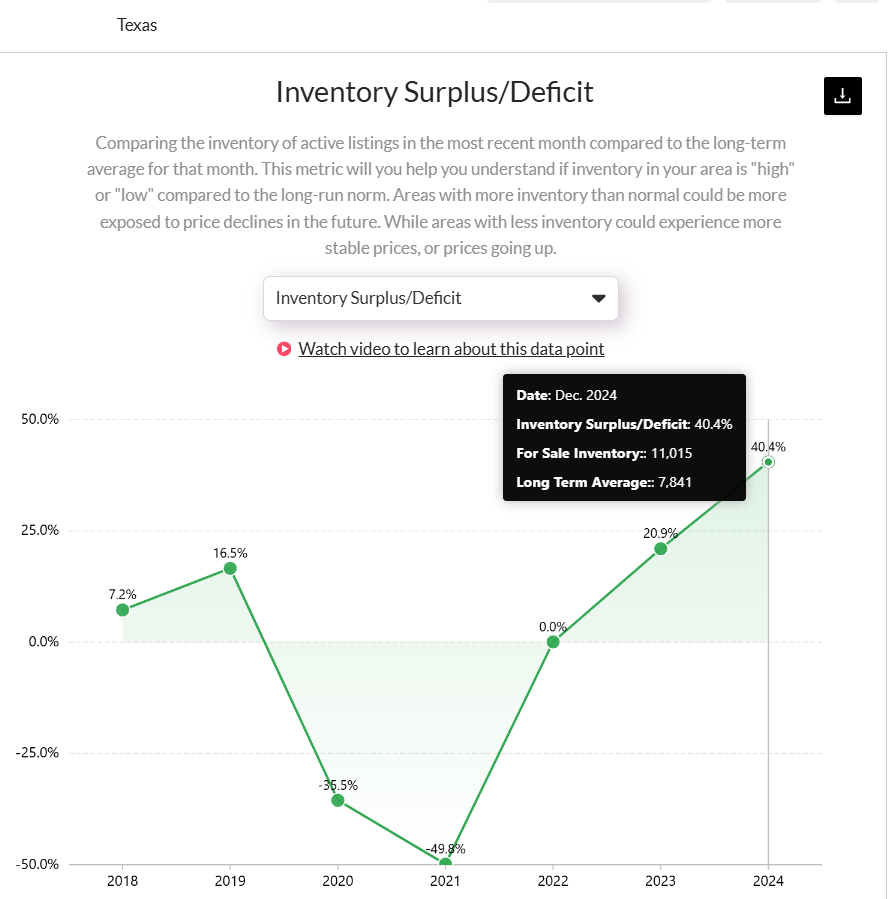
Inventory Surplus/Deficit in the metro reached 40.4% in late 2024, with 11,015 homes for sale exceeding a long-term average of 7,841. Access the graph here. [Link]
By 2023, inventory levels rebounded to a 20.9% surplus. Moreover, in late 2024, the surplus reached 40.4%, with 11,015 homes for sale compared to a long-term average of 7,841. This rising surplus indicates reduced buyer demand, more sellers in the market, longer days on the market, and increased price cuts. These factors are signs of a declining market, pointing to potential future home price declines. Sellers may face challenges, while buyers could find opportunities amid this market shift.
Inventory Surplus/ Deficit Trend in Different Counties of San Antonio, TX
According to data on Reventure App, the inventory surplus/deficit across San Antonio, TX metro counties shows diverse trends entering 2025. Medina County leads with an 83.5% surplus indicating high supply compared to demand. Atascosa County records 53.7%, Bandera County 56.5%, and Comal County 46.1%. In contrast, Bexar County shows a lower surplus of 38.7% followed by Kendall County at 26.6%.
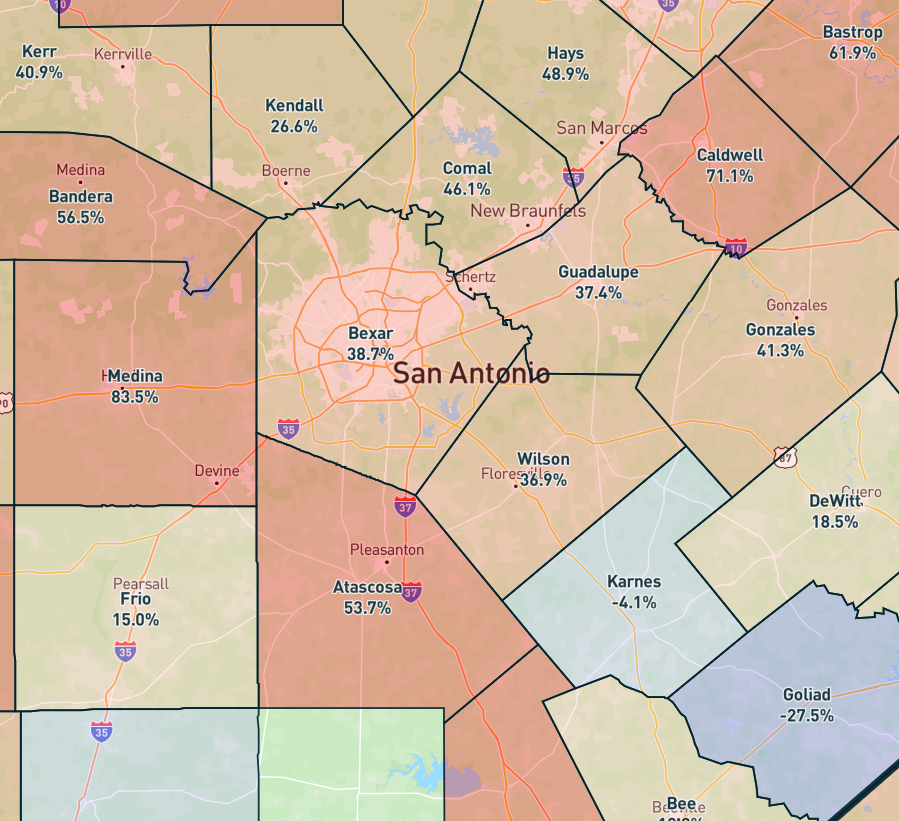
Medina County leads with 83.5% surplus followed by Bandera County with a 56.5% surplus. Access the Inventory Surplus/ Deficit map of San Antonio’s counties here. [Link]
Medina and Bandera Counties exhibit the highest inventory surpluses in the San Antonio metro, reflecting significant housing market shifts. Medina County’s surplus reached 83.5% in late 2024, with 289 homes for sale, up from a long-term average of 157. Bandera County recorded a 56.5% surplus with 220 homes for sale, exceeding its long-term average of 140. Both counties have experienced rising inventory levels over recent years, driven by increased listings and reduced buyer demand. These surpluses suggest longer market times and potential price cuts as supply outpaces demand.
San Antonio, TX Housing Market Predictions for 2025
The housing market in San Antonio, TX, is predicted to remain in a declining trend throughout 2025, following the home price forecast score of 35 out of 100 on Reventure App. This score is well below the stability threshold of 45, indicating cooling market conditions. It’s important to note here that a score below 45 indicates a declining market, 45-55 signals stability, and above 55 suggests an appreciating market. Key factors contributing to this trend include reduced buyer demand, an oversupply of inventory, and longer days on the market.

San Antonio home price forecast shows a declining trend with a score of 35/ 100 in 2024, indicating a continued buyer’s market in 2025. Access the graph here. [Link]
As sellers struggle to attract buyers, the market indicates potential future home price declines. These conditions reflect a buyer’s market, where opportunities for price negotiation and discounts are more prevalent. For buyers, 2025 presents a chance to take advantage of favorable pricing conditions, especially in areas of the San Antonio metro with a high inventory surplus. If you want a detailed analysis of the San Antonio, TX metro area, explore the housing market data at the ZIP-code level on Reventure App.