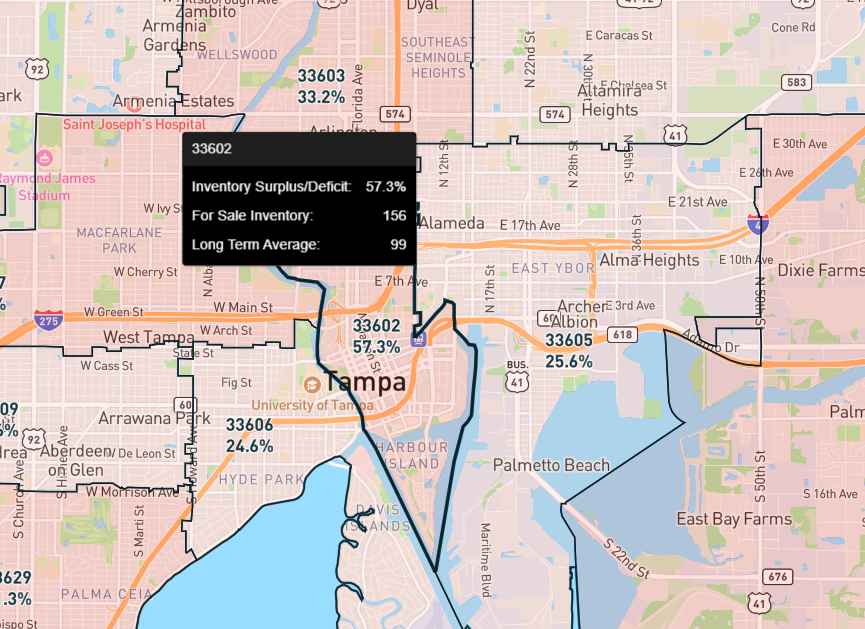
The Tampa, FL, housing market is hitting a downturn in late 2024, marked by a 31.2% year-over-year increase in inventory on a metro level. Active listings surged to 16,065 by November 2024, up from 12,245 the previous year. This expansion reflects a cooling market where reduced buyer demand has allowed more homes to remain available. These figures signal a substantial shift in Tampa’s market conditions, offering new opportunities for buyers and influencing regional trends.
Tampa’s rising inventory numbers highlight a broader trend of fluctuating housing supply in the region over recent years. Between 2017 and 2020, inventory saw consistent declines as demand soared, particularly during the pandemic-driven housing surge. A striking example was the notable 42.7% drop in inventory growth in 2020, showcasing the squeeze in supply caused by heightened demand.
However, according to the YoY chart available on Reventure App, the market took a sharp turn in 2022 with a huge 152% increase in inventory. This rebound was likely driven by market corrections coupled with efforts to meet the sudden increase in demand from prior years.
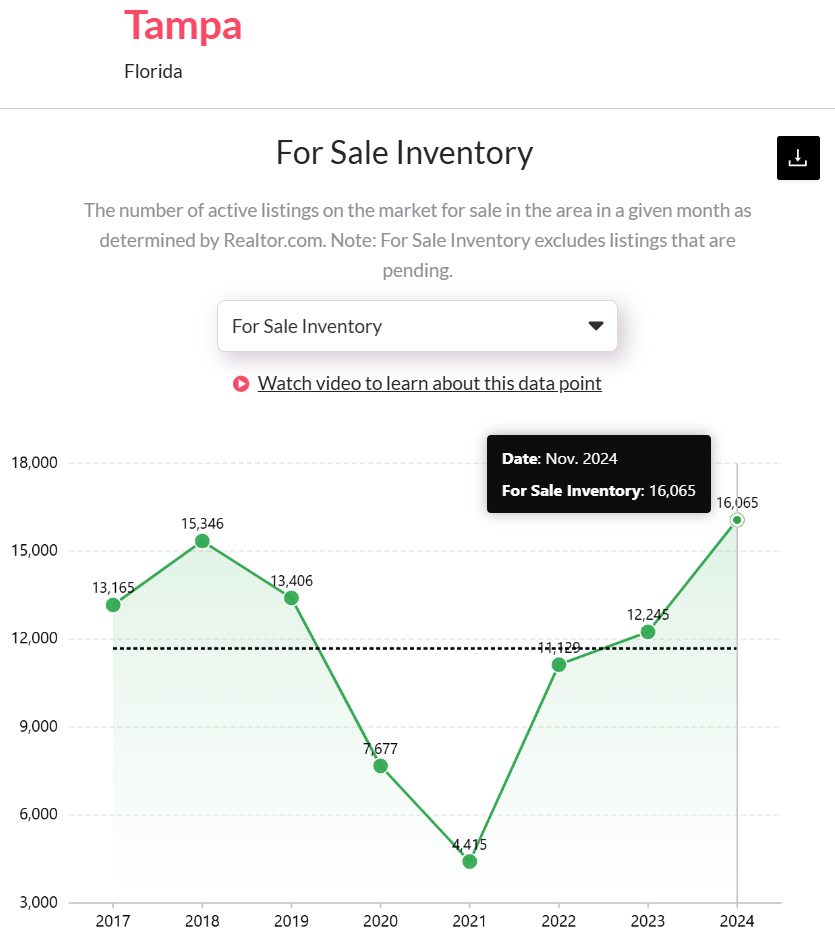
Tampa’s sales inventory reached 16,065 by November 2024. Access the sales inventory data here. [Link]
By November 2024, the metro’s sales inventory growth had again taken a sharp downturn. During this period, Tampa’s listings climbed from a long-term average of 11,469 to 16,065, the highest level in the past seven years. This resurgence points to reduced urgency among buyers as demand has softened, providing a clearer path for inventory accumulation.
Variation in Active Listings Within Tampa, FL
The increase in Tampa’s inventory growth is not uniformly distributed across all counties. The Reventure app’s data reveals that Hillsborough County leads the Tampa metro in active listings, recording 5,490 properties by November 2024. This figure exceeds the county’s long-term average of 4,231 by 29.7%, indicating considerable growth in supply. Pinellas County, on the other hand, posted a surplus of 43% in active listings. Meanwhile, Pasco County leads the metro with the highest surplus of 48.8%.
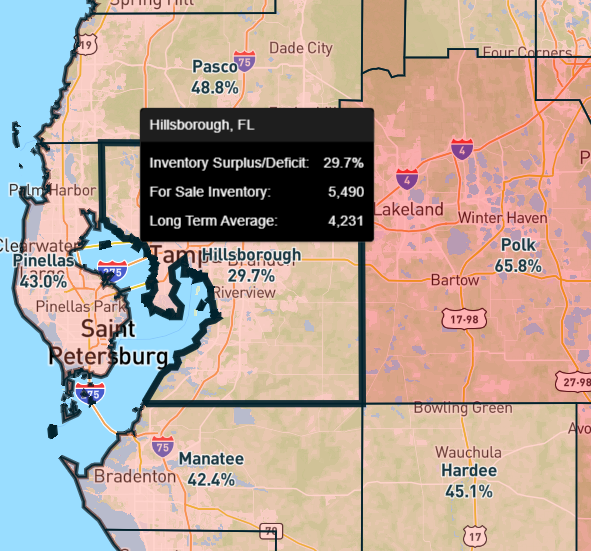
Hillsborough County has the highest number of active listings in Tampa, FL. You can access the numbers here. [Link]
It’s worth noting the historical fluctuations that contribute to these surges in housing supply. According to Reventure App’s inventory surplus/deficit trends, the county’s inventory trends have varied significantly over recent years. For instance, specifically in Hillsborough County, the market went into surplus in 2018 at 39.5%. However, it faced a steep decline to a deficit of 61.7% in 2021 and then reversed to a 29.7% surplus by late 2024. You can also see a Home Price Forecast and Long Term Growth for other counties on Reventure app.
Tampa, FL Housing Market Predictions for 2025
According to Reventure App’s forecast score, we can expect a likely downward trend in home prices in 2025. It’s important to note that a score below 45 denotes a declining market, while a score between 45 and 55 represents stability. The Tampa, FL’s current forecast score of 37 reflects reduced buyer activity, longer days on the market, and increased price cuts. Moreover, the higher inventory levels also suggest a potential price decline in 2025. This could potentially create a competitive market for sellers, with home prices likely trending downward over the next 12 months.

Tampa, FL’s home price forecast suggests a likely downward trend in home prices in 2025. Access the home price forecast trend over the years here. [Link]
As Tampa’s housing market continues to cool off from previous years’ rapid appreciation, buyers, investors, and real estate professionals need to stay informed. The Reventure App offers access to detailed housing market data at a ZIP-code level in Tampa, FL. This allows you to track trends in your specific neighborhood and make well-informed decisions.